Background
When developing new Ansible modules or trying to understand an existing module better, it can be helpful to take advantage of all the features of Pycharm to debug the Python code in the module.
To use the debug features in Pycharm the Python code must be run from within Pycharm. However, the Python code in Ansible is called as a result of running a playbook. Therefore we need a way to run our playbook as we would normally but somehow trigger a Pycharm debug session at the desired point in the Python code. This post describes a method to do this.
Prerequisites
- Local and remote machines – local running Pycharm, remote running the Ansible/Python code. Remote can be a separate physical machine or a VM on your local.
- Must be Pycharm Professional Edition on your local machine.
- SSH connectivity between local and remote machines.
Setup
- On your local machine, set up a new, empty Pycharm project.
- Copy the Python file(s) that you want to debug, from the remote server to the new Pycharm project on your local machine.
- Note: It is likely that in the course of debugging the file, you will want to use the Pycharm ‘Step Into’ feature to debug other functions/modules that the file uses. For ‘Step Into’ to function correctly, the files containing these other functions/modules must also be copied from remote to local. Therefore, unless you are sure that you only want to debug a single file, it is probably easiest to copy the entire Python structure (containing the files you want to debug) from the remote to the new Pycharm project on your local machine
- Configure a new Run/Debug Configuration
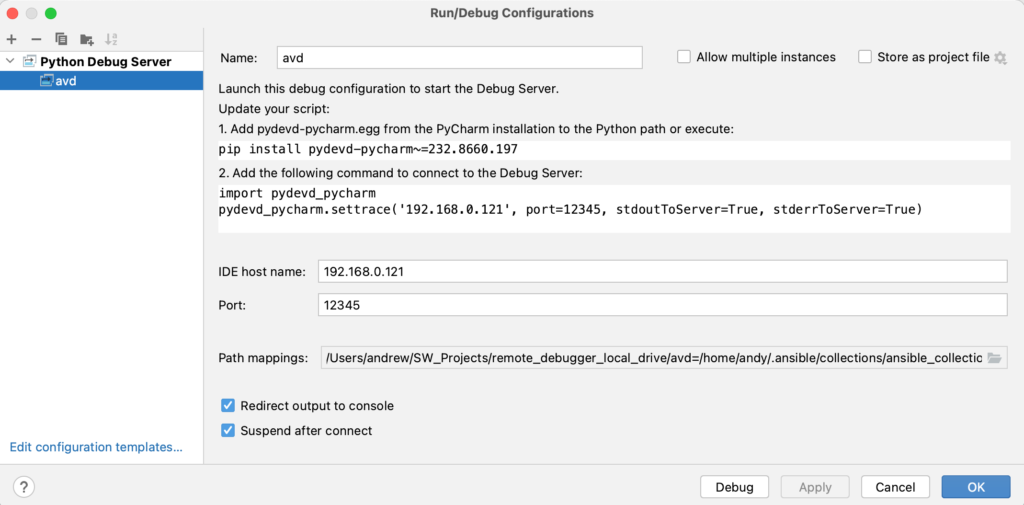
- Use the + to set up a new Python Debug Server
- Give the new server a name
- Specify the IP of your local machine
- Pick any unused port (12345 will usually work)
- Add a Path Mapping.
- Click the grey folder icon at the end of the Path Mappings field.
- Click the ‘+’ to add a new mapping.
- Add a local and remote path. The local path should be the root folder of the new Pycharm project on your local machine and the remote path should be the root folder of the project on the remote machine.
- Select ‘Redirect output to console’ and ‘Suspend after connect’
- Copy the 3 commands that are specified in the ‘Update your script:’ section of the setup window to a text file on your machine for use later
- Select ‘OK’
- On the remote machine run the ‘pip install pydev-pycharm’ command you copied earlier
- On the remote machine open the python file that you want to debug.
- Scroll to the point in the file where you want the breakpoint and paste in the ‘import pydevd_pycharm……..’ and ‘pydevd_pycharm.settrace……..’ commands you copied earlier.
- Save and close the file.
Start the Debug
- On your local machine, run the new Python Debug Server by hitting the green bug icon
- The debug pane should open with a ‘Waiting for process connection…’ message at the bottom of the screen.
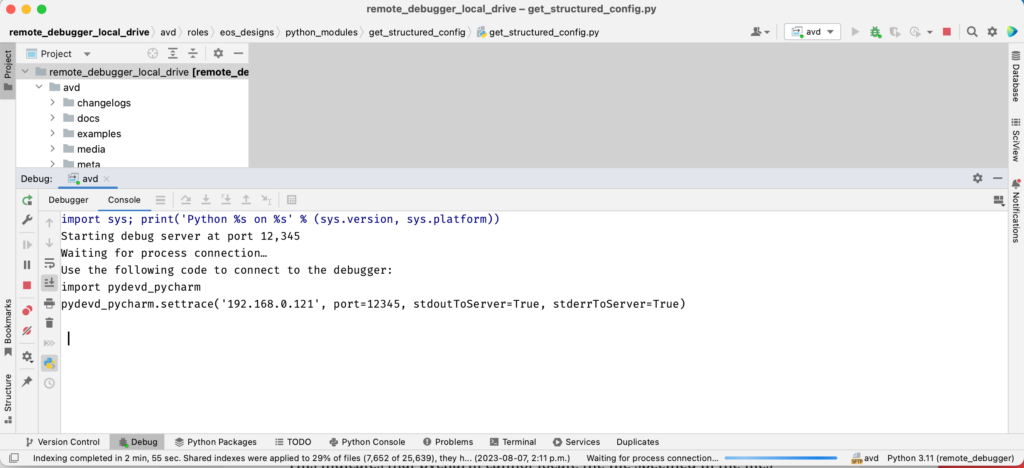
- On the remote machine, run the playbook that uses the Python file you want to debug.
- When the code reaches the point where you have inserted the breakpoint, the remote machine will connect to your local machine and the debug window will open.
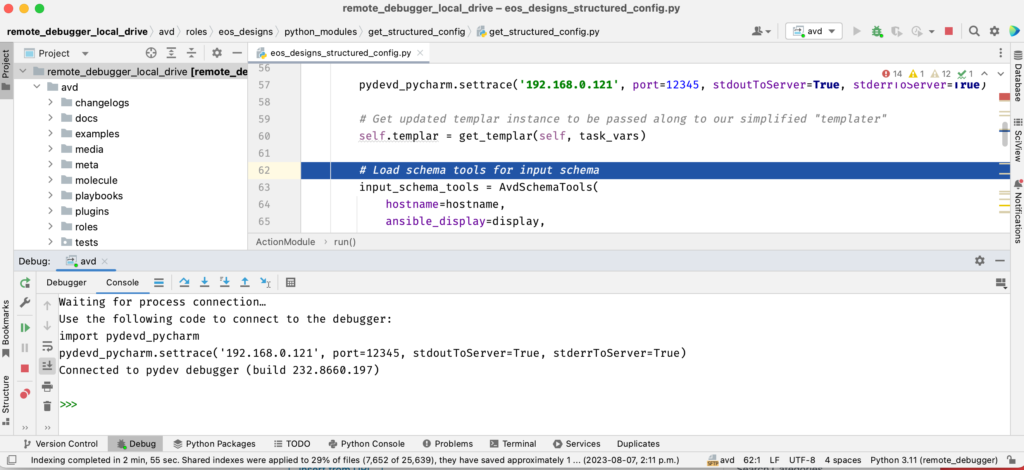
- Click on ‘Debugger’ to see the stack and variables:
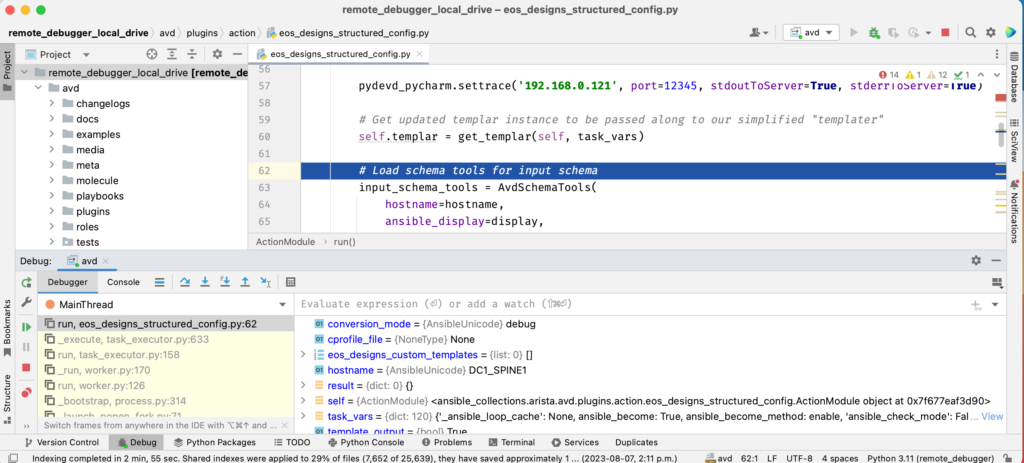
- Debug the code as you would normally using the ‘Step Over’, ‘Step Into’ buttons, etc.
Quick Method
There is a quicker way to start a debug but it does come with significant shortcomings.
It is possible to omit ‘Setup – step 2’ and ‘Setup – step 3 – Add a Path Mapping’.
If you omit these steps, when you start the debug, you should be presented with a window similar to below, with the ‘Edit settings, Auto-detect, and Download’ options.
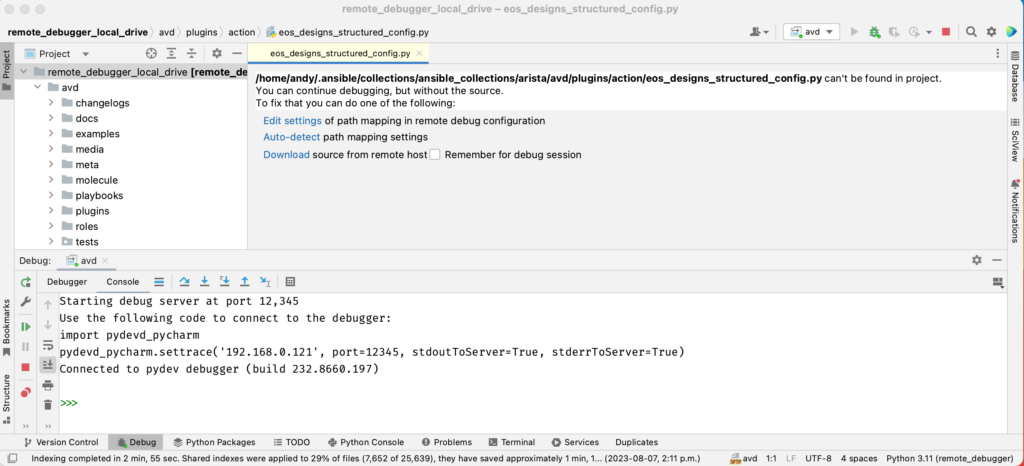
If you select download, the file you want to debug will be downloaded and the debug session will begin:

However, the cursor that normally highlights the position of the debug in the code, is not present. The position of the debug can be determined by looking in the yellow ‘thread’ pane and looking at the line number of the topmost thread (in the above example, 62).
Additionally, although ‘Step over’ works, ‘Step into’ will not work.
If you just want to do a quick check of something like the value of a variable, then this quick method may be enough for you.